
The Typical U.S. Home Is 44 Years Old — And Needs Tons of Work, read a Wall Street Journal headline on April 4th..[1]
This article led us to wonder: How old is the average U.S. food & beverage (“F&B”) plant? And how well have they been maintained? In Saphineia’s experience working with middle market F&B manufacturers, the answer is often “not well enough”.
As it turns out, the average U.S. F&B plant is ~51 years old.[2] But the age of a facility doesn’t tell us a lot as a well-maintained 50-year-old plant can outperform a neglected 20-year-old one. What matters is the condition of the equipment inside those facilities and the consistency of maintenance activity over time.
The real-world implications of neglecting maintenance
In manufacturing environments, maintenance is not optional. When it is neglected, costs surface in several predictable ways:
- Unplanned downtime, which impacts throughput, customer service and margin
- Emergency repairs, which are significantly more expensive than planned work
- Accelerated asset degradation pulls forward capital replacement cycles
- Food safety, quality, and regulatory risks emerge when facilities, infrastructure, and manufacturing equipment are not well maintained
- Employee safety risk increases because neglected maintenance creates hazardous conditions
Unlike residential assets like homes and cars, which may sit idle for long periods, food factories often operate 20 to 24 hours a day, 5 to 7 days a week. A better analogy is a commercial fleet vehicle: highly utilized, constantly under load, and sensitive to neglect.
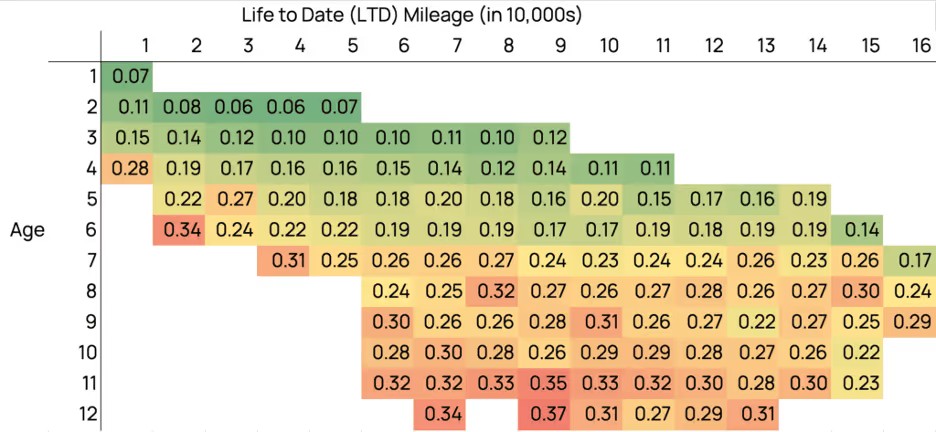
Fleet data reinforces this point. As vehicles age and accumulate mileage, cost per mile increases and maintenance costs accelerate nonlinearly (see below).
Fleet cost per mile trends based on age and mileage
Source: https://www.utilimarc.com/blog/understanding-vehicle-lifecycle-costs-in-fleet-management
The same dynamic applies in manufacturing: the longer maintenance is neglected, the steeper the eventual cost.
Rethinking ‘Buyer beware’: Buyer ‘BE AWARE’
The economics of maintenance are straightforward: every minute of unplanned downtime costs money, and the cost of prevention is nearly always lower than the cost of the fix.
Yet despite its importance to earnings power, risk and long-term cash flow, we rarely see buyers focus on this topic during diligence.
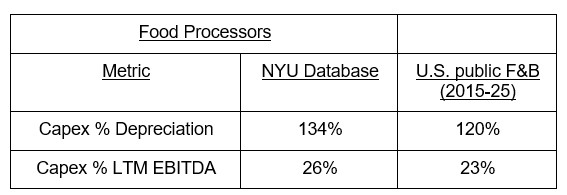
Many buyers rely heavily on EBITDA when evaluating businesses. In capital-light industries, that lens can be a reasonable proxy for value. But F&B manufacturing is not a capital-light business. Industry data shows that F&B companies spend ~25% of annual EBITDA on capex. In other words, the gap between EBITDA and unlevered free cash flow is significant.
Sources: Capital Expenditures, Acquisitions and R&D and Sales/Invested Capital Ratios, Aswath Damodaran, NYU Stern
School of Business; SEC Filings and Saphineia research
Yet this data has limitations too as it does not distinguish between growth capex and sustaining capex, nor does it capture routine maintenance expenses that run through the P&L. Together, these omissions can obscure the true level of investment required to sustain asset performance and EBITDA.
To address this, many practitioners track total spending on sustaining asset performance as a percentage of replacement asset value (RAV) and recommend annual sustainment spending in the range of 2% to 5% of RAV. This provides a more holistic view, capturing both capitalized and expensed maintenance activity.
Recommendations for owners, operators and buyers
A few key questions can quickly reveal whether a business is investing appropriately:
- What is the company spending on total EBITDA-sustaining spending (capex + expense) as a percentage of RAV and how has this number changed over time?
- What does depreciation look like relative to capex? Is the gap widening? Sustained capex below depreciation is often a signal of underinvestment.
- What is the age profile of critical production equipment? When was the last major overhaul or replacement cycle?
- What is the level of downtime caused by breakdowns? What are the top causes? How has this trended? What is the meantime-between-failures (MTBF)?
- Is there a formal preventive maintenance program in place? What percentage of maintenance work is planned versus reactive?
- What is the level and age of the items in your maintenance backlog? If so, how has it been sized and prioritized?
Conclusions
For operators, disciplined maintenance improves uptime, reduces variability, and protects margins. For owners, it preserves asset value and avoids costly surprises. For buyers, analyzing maintenance spend provides a clearer picture of true earnings power and future reinvestment requirements. In all cases, the principle is the same: maintenance is not a discretionary cost to be minimized, but a strategic investment to be managed.
If you’re interested in learning more about how leading F&B manufacturers build reliability as a core capability, see our Insight: Maintenance as a Competitive Advantage: Building Reliability as a Core Capability.
[1]“The Typical U.S. Home Is 44 Years Old—And Needs Tons of Work,” The Wall Street Journal.